| | Oil
and Natural Gas Reserve Replacement Finding and
developing sufficient amounts of natural gas and crude oil reserves at economical
costs are critical to our longterm success. Given the inherent decline of hydrocarbon
reserves resulting from the production of those reserves, it is important for
an exploration and production company to demonstrate a long-term trend of more
than offsetting produced volumes with new reserves that will provide for future
production. Management uses the reserve replacement ratio, as defined below, as
an indicator of our ability to replenish annual production volumes and grow our
reserves, thereby providing some information on the sources of future production.
We believe reserve replacement information is frequently used by analysts, investors
and others in the industry to evaluate the performance of companies like ours.
The reserve replacement ratio is calculated by dividing the sum of reserve additions
from all sources (revisions, extensions, discoveries, and other additions and
acquisitions) by the actual production for the corresponding period. The values
for these reserve additions are derived directly from the proved reserves table
above. We do not use unproved reserve quantities in calculating our reserve replacement
ratio. It should be noted that the reserve replacement ratio is a statistical
indicator that has limitations. As an annual measure, the ratio is limited because
it typically varies widely based on the extent and timing of new discoveries and
property acquisitions. Its predictive and comparative value is also limited for
the same reasons. In addition, since the ratio does not take into consideration
the cost of timing of future production of new reserves, it cannot be used as
a measure of value creation. The ratio does not distinguish between changes in
reserve quantities that are producing and those that will require additional time
and funding to begin producing. In that regard, it might be noted that percentage
of reserves that were producing varied from 11.2% in 2003, to 17.2% in 2004 and
to 19.1% in 2005. Set forth below is our reserve replacement ratio for the year
ended December 31, 2005, 2004 and 2003. 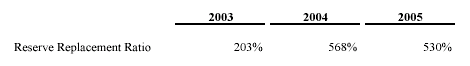
Volumes,
Prices and Oil & Natural Gas Operating Expense The
following table sets forth certain information regarding the production volumes
of, average sales prices received for and average production costs associated
with our sales of oil and natural gas for the periods indicated. For 2003, the
table includes the cash impact of hedging activities. 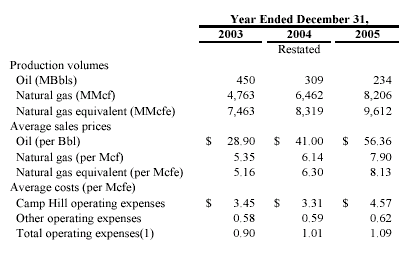
| (1)
| Includes direct lifting costs
(labor, repairs and maintenance, materials and supplies), workover costs and the
administrative costs of production offices, insurance and property and severance
taxes. |
Finding and Development Costs
The table below reconciles our calculation of finding
cost to our costs incurred in the purchase of proved and unproved properties and
in development and exploration activities, excluding capitalized interest on unproved
properties of $2.9 million, $2.9 million and $5.8 million for the years ended
December 31, 2003, 2004 and 2005, respectively. We have also included capitalized
overhead in our finding cost of $1.4 million, $1.7 million and $2.1 million for
the years ended December 31, 2003, | |