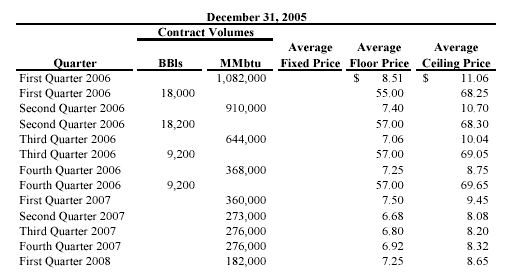
The
table below summarizes our total natural gas production volumes subject to derivative
transactions during 2005. 
The
table below summarizes our total crude oil production volumes subject to derivative
transactions during 2005. 
Since
year-end 2005, we entered into costless collar arrangements covering 27,600 Bbls
of crude oil for July 2006 through December 2006 production comprised as follows:
18,400 Bbls in the third quarter 2006 with average floor and ceiling prices of
$60.00 and $70.80, respectively, 9,200 Bbls in the fourth quarter 2006 with average
floor and ceiling prices of $60.00 and $72.20, respectively. We also entered into
swap arrangements covering 244,000 MMBtu of natural gas for April 2006 and July
2006 production at an average fixed price of $7.00. Item
7A. Qualitative and Quantitative Disclosures About Market Risk Commodity
Risk. Our major market risk exposure is the commodity pricing applicable to
our oil and natural gas production. Realized commodity prices received for such
production are primarily driven by the prevailing worldwide price for oil and
spot prices applicable to natural gas. The effects of such pricing volatility
have been discussed above, and such volatility is expected to continue. A 10%
fluctuation in the price received for oil and gas production would have an approximate
$7.8 million impact on our annual revenues and operating income. To
mitigate some of this risk, we engage periodically in certain limited hedging
activities, including price swaps, costless collars and, occasionally, put options,
in order to establish some price floor protection. Costs and any benefits derived
from these price floors are accordingly recorded as a reduction or increase, as
applicable, in oil and gas sales revenue and were not significant for any year
presented. The costs to purchase put options are amortized over the option period.
We do not hold or issue derivative instruments for trading purposes. Income and
(losses) realized by us related to these instruments were $(1.8) million, $(1.0)
million and $(2.3) million or $(0.46), $(0.21) and $(0.50) per MMBtu for the years
ended December 31, 2003, 2004, and 2005, respectively. Interest
Rate Risk. Our exposure to changes in interest rates results from our floating
rate debt. The result of a 10% fluctuation in short-term interest rates would
have impacted 2005 cash flow by approximately $0.2 million. |