| |
Because natural gas and oil prices are unstable,
we periodically enter into price-risk-management transactions such
as swaps, collars, futures and options to reduce our exposure to
price fluctuations associated with a portion of our natural gas
and oil production and to achieve a more predictable cash flow.
The use of these arrangements limits our ability to benefit from
increases in the prices of natural gas and oil. Our hedging arrangements
may apply to only a portion of our production and provide only partial
protection against declines in natural gas and oil prices.
RESULTS OF OPERATIONS
Year Ended December 31, 2004 Compared
to the Year Ended December 31, 2003
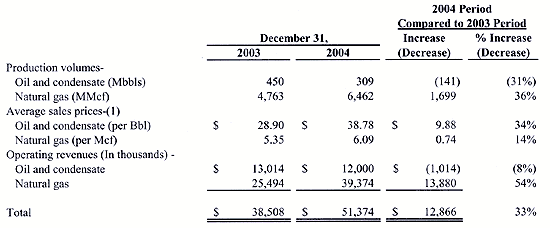
Oil and natural gas revenues for 2004 increased
33% to $51.4 million from $38.5 million in 2003. Production volumes
for natural gas in 2004 increased 36% to 6,462 MMcf from 4,763 MMcf
in 2003. Realized average natural gas prices increased 14% to $6.09
per Mcf in 2004 from $5.35 per Mcf in 2003. Production volumes for
oil in 2004 decreased 31% to 309 MBbls from 450 MBbls in 2003. The
increase in natural gas production was primarily due to the commencement
of production from the Beach House #1 and #2, the Peal Ranch wells,
the Barnett Shale wells, the Shadyside #1 (which we later sold in
February 2005), the new Encinitas wells and the LL&E #1, partially
offset by the natural decline in production from the Hankamer #1,
Espree #1, Staubach #1, Burkhart #1R, Pauline Huebner A-382 #1,
Matthes Huebner #1, Pitchfork Ranch #1 and other wells. The decrease
in oil production was due primarily to the natural decline of production
at the Staubach #1, Burkhart #1R, Pauline Huebner A-382 #1, Beach
House #1, Matthes Huebner #1, Hankamer #1 and Espree #1, partially
offset by the commencement of production from the Delta Farms #1
workover, LL&E #1 and other wells. Oil and natural gas revenues
include the impact of hedging activities as discussed below under
"Volatility of Oil and Gas Prices."
Average oil prices increased 34% to $38.78
per Bbl in 2004 from $28.90 per Bbl in 2003.
The following table summarizes production volumes,
average sales prices and operating revenues for our oil and natural
gas operations for the years ended December 31, 2003 and 2004:

(1) Including the impact of hedging.
Oil and natural gas operating expenses for
2004 increased 25% to $8.4 million from $6.7 million in 2003. Oil
and natural gas operating expenses increased primarily due to higher
severance taxes of $0.7 million on higher commodity prices, while
higher lifting costs of $0.9 million were attributable to the increased
number of producing wells and in part due to higher ad valorem taxes.
Operating expenses per equivalent unit in 2004 increased to $1.01
per Mcfe from $0.90 per Mcfe in 2003. The per unit cost increased
primarily as a result of the higher costs noted above.
Depreciation, depletion and amortization
("DD&A") expense for 2004 increased 30% to $15.4 million from $11.9
million in 2003. This increase was primarily due to the increased
land, seismic and drilling costs added to the proved property cost
base.
31
|
|