| |
Contingencies
Liabilities and other contingencies are recognized
upon determination of an exposure, which when analyzed indicates
that it is both probable that an asset has been impaired or that
a liability has been incurred and that the amount of such loss is
reasonably estimable.
VOLATILITY OF OIL AND NATURAL GAS PRICES
Our revenues, future rate of growth, results
of operations, financial condition and ability to borrow funds or
obtain additional capital, as well as the carrying value of our
properties, are substantially dependent upon prevailing prices of
oil and natural gas. See "Management's Discussion and Analysis of
Financial Condition and Results of Operations--Risk Factors--Natural
gas and oil prices are highly volatile, and lower prices will negatively
affect our financial results."
We periodically review the carrying value of
our oil and natural gas properties under the full cost accounting
rules of the Commission. See "--Critical Accounting Policies and
Estimates--Oil and Natural Gas Properties" and "--Risk Factors--
We may record ceiling limitation write-downs that would reduce our
shareholders' equity."
Total oil purchased and sold under swaps and
collars during 2002, 2003 and 2004 were 131,300 Bbls, 193,600 Bbls
and 121,700, respectively. Total natural gas purchased and sold
under swaps and collars in 2002, 2003 and 2004 were 2,314,000 MMBtu,
2,739,000 MMBtu and 3,936,000 MMBtu, respectively. The net gains
and (losses) realized by us under such hedging arrangements were
$(0.9 million), $(1.8 million) and $1.0 million for 2002, 2003 and
2004, respectively, and are included in oil and natural gas revenues.
To mitigate some of our commodity price risk,
we engage periodically in certain other limited hedging activities
including price swaps, costless collars and, occasionally, put options,
in order to establish some price floor protection. We record the
costs and any benefits derived from these price floors as a reduction
or increase, as applicable, in natural gas and oil sales revenue;
these reductions and increases were not significant for any year
presented in the financial information included in this report.
The costs to purchase put options are amortized over the option
period. We do not hold or issue derivative instruments for trading
purposes.
As of December 31, 2004, $59,000, net of tax
of $34,000, remained in accumulated other comprehensive income related
to the valuation of our hedging positions.
While the use of hedging arrangements limits
the downside risk of adverse price movements, it may also limit
our ability to benefit from increases in the prices of natural gas
and oil. We enter into the majority of our hedging transactions
with two counterparties and have a netting agreement in place with
those counterparties. We do not obtain collateral to support the
agreements but monitor the financial viability of counterparties
and believe our credit risk is minimal on these transactions. Under
these arrangements, payments are received or made based on the differential
between a fixed and a variable product price. These agreements are
settled in cash at expiration or exchanged for physical delivery
contracts. In the event of nonperformance, we would be exposed again
to price risk. We have some risk of financial loss because the price
received for the product at the actual physical delivery point may
differ from the prevailing price at the delivery point required
for settlement of the hedging transaction. Moreover, our hedging
arrangements generally do not apply to all of our production and
thus provide only partial price protection against declines in commodity
prices. We expect that the amount of our hedges will vary from time
to time.
Our gas derivative transactions are generally
settled based upon the average of the reporting settlement prices
on the NYMEX for the last three trading days of a particular contract
month. Our oil derivative transactions are generally settled based
on the average reporting settlement prices on the NYMEX for each
trading day of a particular calendar month. For the month of December
2004, a $0.10 change in the price per Mcf of gas sold would have
changed revenue by $71,000. A $0.70 change in the price per barrel
of oil would have changed revenue by $16,000.
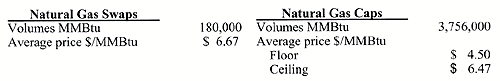
The table below summarizes our total natural
gas production volumes subject to derivative transactions during
2004 and the weighted average NYMEX reference price for those volumes.
42
|
|